visutils
Intoruction
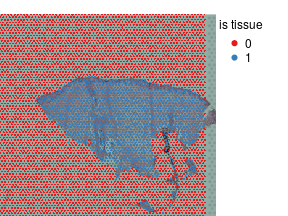
Visium slides can contain more than one tissue piece (slice), either because more than one slice were purposely placed on slide, or it can be tissue derbies or false positive of spaceranger tissue autodetection. One can deal with these problems using manual annotation in loupe browser (for example), however it works only for small datasets. Some automation is needed for larger ones. Here I will show how to define tissue pieces on visium slide (starting from spaceranger tissue autodetection), remove small one that likely to be derbies, and annotate tissue border in semi-automated way using visutils.
Load libraries
# devtools::install_github("cellgeni/visutils",force = TRUE)
library(visutils)
library(Seurat)
Load data
Lets take one random skin sample from https://www.ebi.ac.uk/biostudies/arrayexpress/studies/E-MTAB-13084 (we need all spots including empty, so we cannot use portal).
sid = 'WSSKNKCLsp10446623'
tmpfile = tempfile()
download.file(paste0('https://www.ebi.ac.uk/biostudies/files/E-MTAB-13084/',sid,'.tar.gz'),tmpfile,quiet = TRUE)
tmpdir = tempdir()
system(paste0('cd ',tmpdir,'; tar -xzf ',tmpfile))
vis = myLoad10X_Spatial(tmpdir,filter.matrix = FALSE)
par(mar=c(0,0,1,5),bty='n')
plotVisium(vis,as.character(vis$is.tissue),legend.args = list(title='is tissue'),cex=0.6)
Define tissue pieces and their borders
border = findTissueBorder(vis)$rc
par(mar=c(0,0,1,10),bty='n')
plotVisium(vis,as.character(border$tissue.piece),
           border=ifelse(border$is.border,'black',NA),
           legend.args = list(title='Tissue piece'),show.cluster.sizes = TRUE)
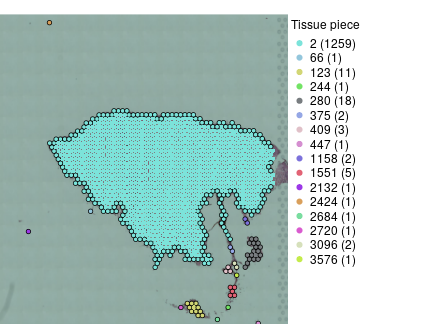
findTissueBorder return list of two objects, data.frame rc that contains information about tissue pieces and their borders and list nj that gives spatial neighbours for each spot. We will need only the former. So, there is one large tissue piece, some obvious debris and few larger pieces that can be probably kept but we will remove them for now.
pieces.size = sort(table(border$tissue.piece),decreasing = TRUE)
f = !is.na(border$tissue.piece) & border$tissue.piece == names(pieces.size)[1]
visf = vis[,f]
#> Warning: Not validating Seurat objects
borderf = border[f,]
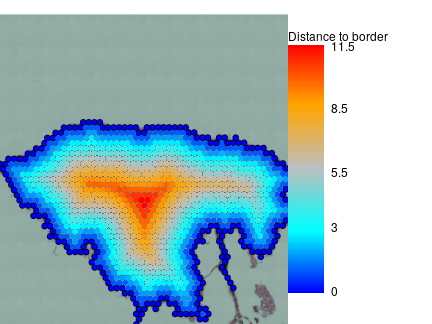
visf$distance2border = calcDistance2SpotSet(visf,borderf$is.border)
par(mar=c(0,0,1,10),bty='n')
plotVisium(visf,visf$distance2border,
border=ifelse(borderf$is.border,'black',NA),
legend.args = list(title='Distance to border'))
Define epidermis
So we successfully removed debris and found tissue border. This approach can be also used to define two different tissue pieces analysed on the same slide with exception that distance to border should be calculated in per piece manner in this case. This sample it skin and piece border is probably not very important, what one may need it skin surface that is epidermal part of the border. Here it is on the top of skin and it can be defined manually or one can check expression of marker genes, for example keratins 1 and 10.
f = visf[['Spatial']]@meta.data$gene_name %in%  c('KRT1','KRT10')
krt.cp10k = colSums(visf[['Spatial']]$counts[f,,drop=FALSE])/visf$nCount_Spatial*1e4

par(mfrow=c(2,2),mar=c(4,4,1,5),bty='n')
plotVisium(visf,krt.cp10k,
           border=ifelse(borderf$is.border,'black',NA),
           legend.args = list(title='total KRT exp'))
b = plotVisium(visf,borderf$border.inx,
           legend.args = list(title='border index'))
text(b$xy[,1],b$xy[,2],borderf$border.inx,adj=c(0,0),cex=0.5,srt=60)
plot(borderf$border.inx,krt.cp10k,pch=16,xlab='border index',ylab='KRT1 + KRT10 CP10K')
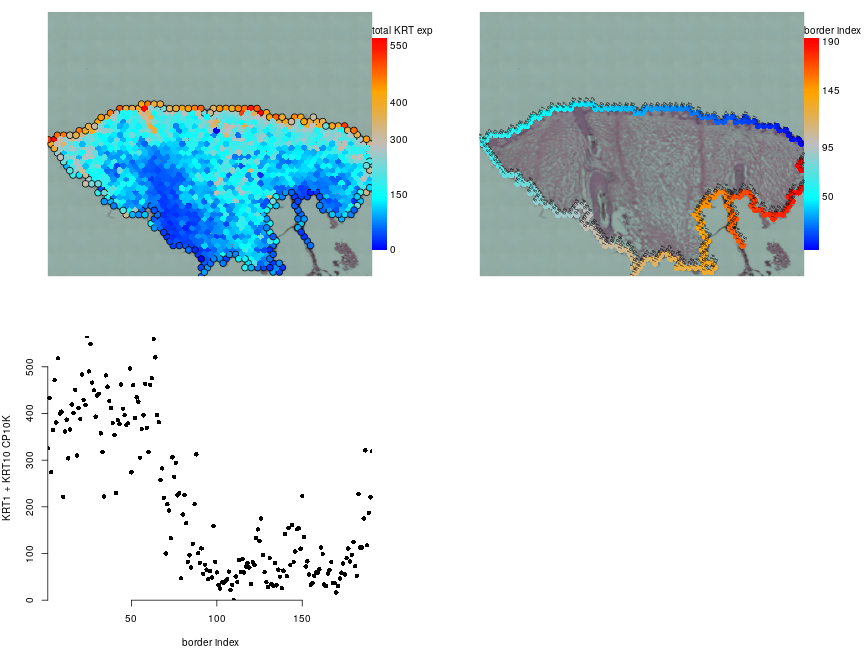 Based on H&E and keratins expression it seems that epidermis corresponds to border spots 1-64.
visf$is.epi = !is.na(borderf$border.inx) & borderf$border.inx %in% 1:64
visf$distance2epi = calcDistance2SpotSet(visf,visf$is.epi)
par(mar=c(0,0,1,10),bty='n')
plotVisium(visf,visf$distance2epi,
           border=ifelse(visf$is.epi,'black',NA),
           legend.args = list(title='Distance to epidermis'))
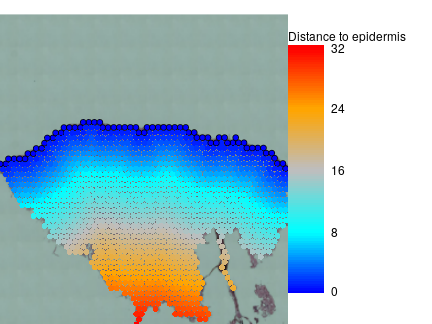
This annotation can be used for Tissue in depth analyses.